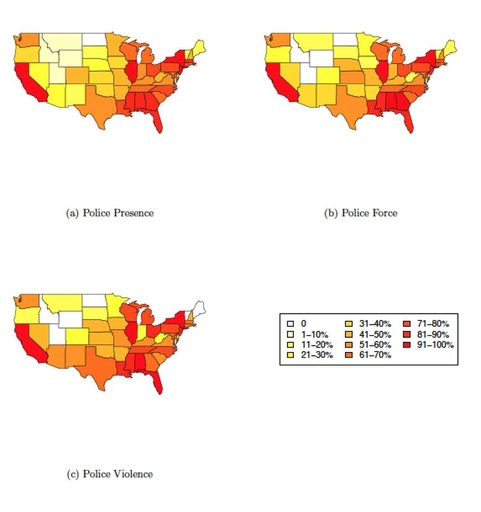
Years ago when I first started working with Sarah Soule (Stanford University) on protest policing in the United States from 1960 to 1990, I became interested in what the data looked like over time. I found a student to graph the material, stitched the images together and made the movie below.
For information regarding how the data were coded, see the following: Dynamics of Collective Action, 1960-1995
Data created by Sarah Soule, Susan Olzak, John McCarthy and Doug McAdam
- This video captures the % of protest events with arrests
- This video captures the % of protest events with force and violence
- This video captures the % of arrests, force and violence at protest events
For information regarding how the data were coded, see the following: Dynamics of Collective Action, 1960-1995
Data created by Sarah Soule, Susan Olzak, John McCarthy and Doug McAdam

